Debugging
Console Debugging · Hit Box Visualization · Source-Level Debugging · Network Debugging · Application Debugging · Element Inspection
📋 Table of Contents
🐛 Debugging
| DevTools Tab | What I Used It For |
|---|---|
| Console Debugging | Every HP change, defeat event, laser spawn, and vulnerability reset logs to the console. I can track the full game state in real time across all 60fps frames without pausing execution. |
| Hit Box Visualization | drawHitbox() draws a red rectangle + fill over the boss sprite showing the exact collision boundary. I used this to fix misaligned hit detection where the sprite image didn't match the logical hitbox rectangle. |
| Source-Level Debugging | Set a breakpoint inside takeDamage() to pause execution mid-frame, step through the invulnerability check line by line, and inspect this.health, this.isVulnerable, and this.lastDamagedAt in the Scope panel. |
| Network Debugging | Inspected the leaderboard fetch() calls — verified the POST request body was correctly JSON-serialized, checked HTTP status codes (200 vs 401 vs 500), identified CORS errors, and read the raw response JSON. |
| Application Debugging | Checked cookies and localStorage to verify the user's login session was persisting correctly between page reloads, and confirmed the auth token was being sent with API requests. |
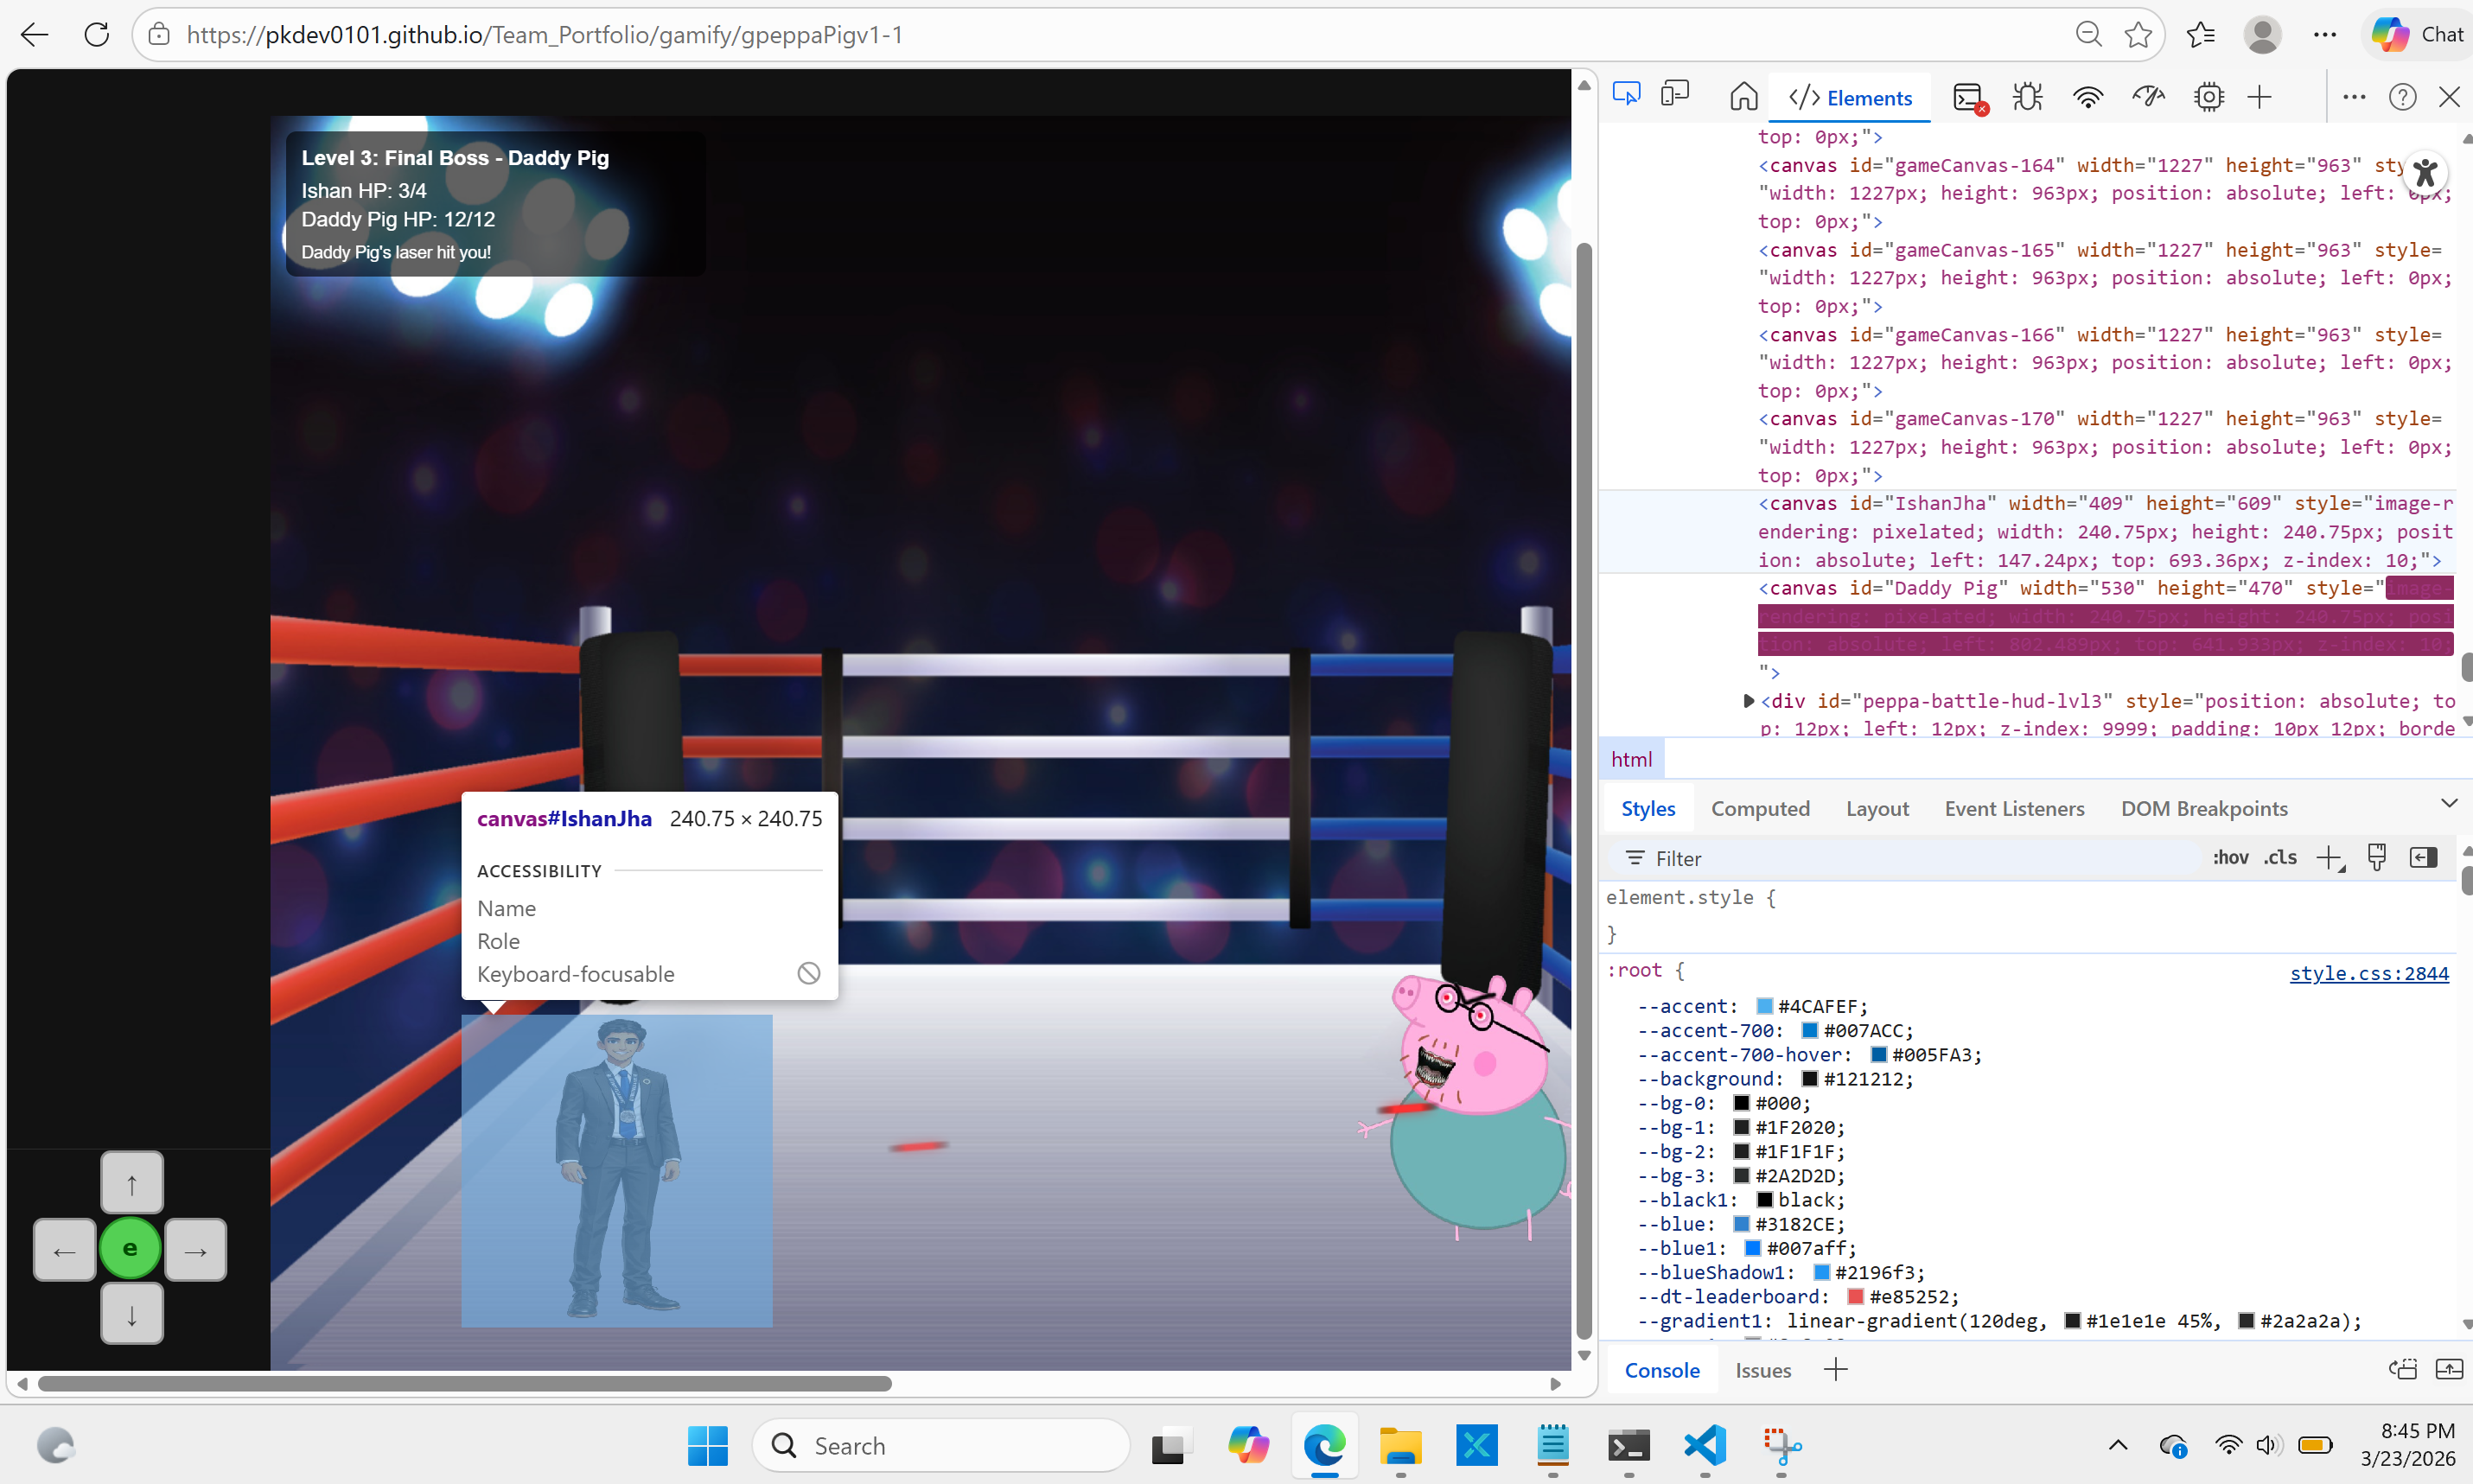
| Element Inspection | Used the Element Viewer to inspect the game's canvas element, HUD div, and laser overlay canvas. Verified CSS positioning of the HUD and confirmed the laser layer canvas was appended to the correct container. |
Console Debugging — Code Example
Every state-changing operation in the game logs a prefixed message so the full game state can be tracked in real time at 60fps without pausing.
// Strategic console.log — prefixed tags make logs easy to filter in DevTools
console.log(`[PeppaBossEnemy] Spawned: ${data?.id} with ${this.health} HP`);
console.log(`[Boss] Hit! HP: ${this.health}/${this.maxHealth}`);
console.log(`[Boss] Defeated!`);
console.log(`[Boss] Invulnerable, ignoring damage.`);
console.log(`[Hitbox] pos=(${Math.round(this.position.x)},${Math.round(this.position.y)})`);
console.log(`[Leaderboard] Score saved:`, data);
console.error(`[Leaderboard] POST failed:`, error.message);
Console Debugging Practice
Run this to see prefixed log tags in action. Try changing the HP or adding more takeDamage() calls.
Hit Box Visualization — Code Example
The drawHitbox() method overlays a red rectangle on the boss sprite showing the exact collision boundary. Toggle it on during a live game session to see if the hitbox matches the visible sprite.
/**
 * Draws a red rectangle over the boss sprite for collision debugging.
 * Only active when this.showHitbox === true (toggled by toggleHitbox()).
 */
drawHitbox() {
  const ctx = this.gameEnv?.ctx;
  if (!ctx) return;
  ctx.save();
  ctx.strokeStyle = 'rgba(255, 0, 0, 0.85)';  // red outline
  ctx.lineWidth   = 2;
  ctx.strokeRect(this.position.x, this.position.y, this.width, this.height);
  ctx.fillStyle   = 'rgba(255, 0, 0, 0.08)';   // faint red fill
  ctx.fillRect(this.position.x, this.position.y, this.width, this.height);
  ctx.restore();
  console.log(`[Hitbox] pos=(${Math.round(this.position.x)},${Math.round(this.position.y)}) size=${this.width}x${this.height}`);
}

// toggleHitbox() switches the debug view on/off without restarting the game
toggleHitbox() {
  this.showHitbox = !this.showHitbox;
  console.log(`[Hitbox] now ${this.showHitbox ? 'ON' : 'OFF'}`);
  return this.showHitbox;
}

// In update() — only draws hitbox when flag is true
if (this.showHitbox) this.drawHitbox();widthPercentage: 0.45 and heightPercentage: 0.6 in the sprite config shrunk the hitbox to match the visible body, making combat feel accurate.
Hit Box Visualization Practice
Run this to see hitbox math in action — the logical hitbox is smaller than the sprite. Try changing the percentage values.
Source-Level Debugging — Code Example
Setting a breakpoint inside takeDamage() in the Sources tab pauses JS execution mid-frame, letting you step through the invulnerability check line by line and inspect live variable values.
// Set breakpoint on the line below in Chrome DevTools → Sources tab
// When a laser hits the boss, execution pauses here. Inspect:
//   this.health, this.isVulnerable, this.lastDamagedAt in the Scope panel
takeDamage(amount = 1) {
  if (this.isDefeated) return true;   // ← add breakpoint here
  if (!this.isVulnerable) {
    console.log('[Boss] Invulnerable - hit blocked');
    return false;
  }
  this.health = Math.max(0, this.health - amount);
  this.isVulnerable  = false;
  this.lastDamagedAt = Date.now();    // ← step over to see this update in Scope
  if (this.health === 0) this.isDefeated = true;
  return this.isDefeated;
}

// Invulnerability reset — also useful to breakpoint to verify timer works
update() {
  if (!this.isVulnerable) {
    if (Date.now() - this.lastDamagedAt >= this.invulnerabilityMs) {
      this.isVulnerable = true;  // ← breakpoint here verifies 300ms resets correctly
    }
  }
}
Source-Level Debugging Practice
This simulates stepping through takeDamage() line by line. Run it to see what the Scope panel would show at each step.
Network Debugging — Code Example
The Network tab shows every fetch() call with its request body, response status, and response JSON — essential for verifying the leaderboard API sends and receives correctly.
// This fetch() call appears in the Network tab when the player wins
async postScore(playerName, score) {
  try {
    const response = await fetch(`${this.pythonURI}/api/leaderboard`, {
      method:  'POST',
      headers: { 'Content-Type': 'application/json' },
      body:    JSON.stringify({ player: playerName, score: score })
      // Network tab → Request tab: verify body is correct JSON
    });
    // Network tab → Response tab: check status code (200=OK, 401=unauth, 500=error)
    if (!response.ok) throw new Error(`HTTP ${response.status}`);
    const data = await response.json();
    console.log(`[Leaderboard] Score saved:`, data);
    return data;
  } catch (error) {
    // Network tab → shows red failed request if CORS or network error
    console.error(`[Leaderboard] POST failed:`, error.message);
    return null;
  }
}
Network Debugging Practice
Run this to simulate a leaderboard POST with a mock response — the same pattern you'd inspect in the Network tab.
Application Debugging — Code Example
The Application tab shows cookies and localStorage — used to verify the auth session token persists between page reloads and is included with API requests.
// Application tab → Cookies: verify jwt/session cookie is present
// Application tab → Local Storage: check for stored game data

// These values can be inspected in Application → Local Storage → localhost
localStorage.setItem('peppaPigHighScore', score);
localStorage.getItem('peppaPigHighScore');   // visible in Application tab

// Cookie-based auth token sent automatically with credentialed fetch
const fetchOptions = {
  credentials: 'include',   // ← sends cookies; verify in Application → Cookies
  headers: { 'Content-Type': 'application/json' }
};

// Application tab confirmed the jwt cookie was present and not expired
// before the leaderboard POST was tested with Network tab
Application Debugging Practice
Run this to simulate localStorage get/set — the same values you'd inspect in Application → Local Storage in DevTools.
Element Inspection — Code Example
The Elements tab reveals the game's canvas element, HUD overlay, and laser canvas — used to verify CSS positioning and confirm the layer structure was correct.
// The game creates multiple canvas/div elements — inspect them in Elements tab

// Main game canvas (sprites are drawn here)
const gameCanvas = document.getElementById('gameCanvas');
gameCanvas.style.position = 'absolute';
gameCanvas.style.top      = '0';
gameCanvas.style.left     = '0';

// Laser overlay canvas (appended on top of game canvas)
this.laserCanvas = document.createElement('canvas');
this.laserCanvas.style.position = 'absolute';
this.laserCanvas.style.zIndex   = '10';   // ← Elements tab shows computed z-index
this.gameContainer.appendChild(this.laserCanvas);

// HUD div (health bars, score) — inspect CSS in Elements tab Styles panel
this.hudElement = document.createElement('div');
this.hudElement.style.position = 'absolute';
this.hudElement.style.zIndex   = '20';   // above laser canvas
this.gameContainer.appendChild(this.hudElement);
Element Inspection Practice
Run this to see the layer stack the Elements tab would show — canvas, laser overlay, and HUD div with their z-index values.